


Based on recommendations from Incling’s prior Student Journey Mapping project for TAFE Queensland Brisbane (TQB), a number of issues relating to underlying systems and processes were highlighted. Incling was engaged to determine these services, that had a direct or indirect effect on user experience could be improved and streamlined across the organisation to better serve students and staff.
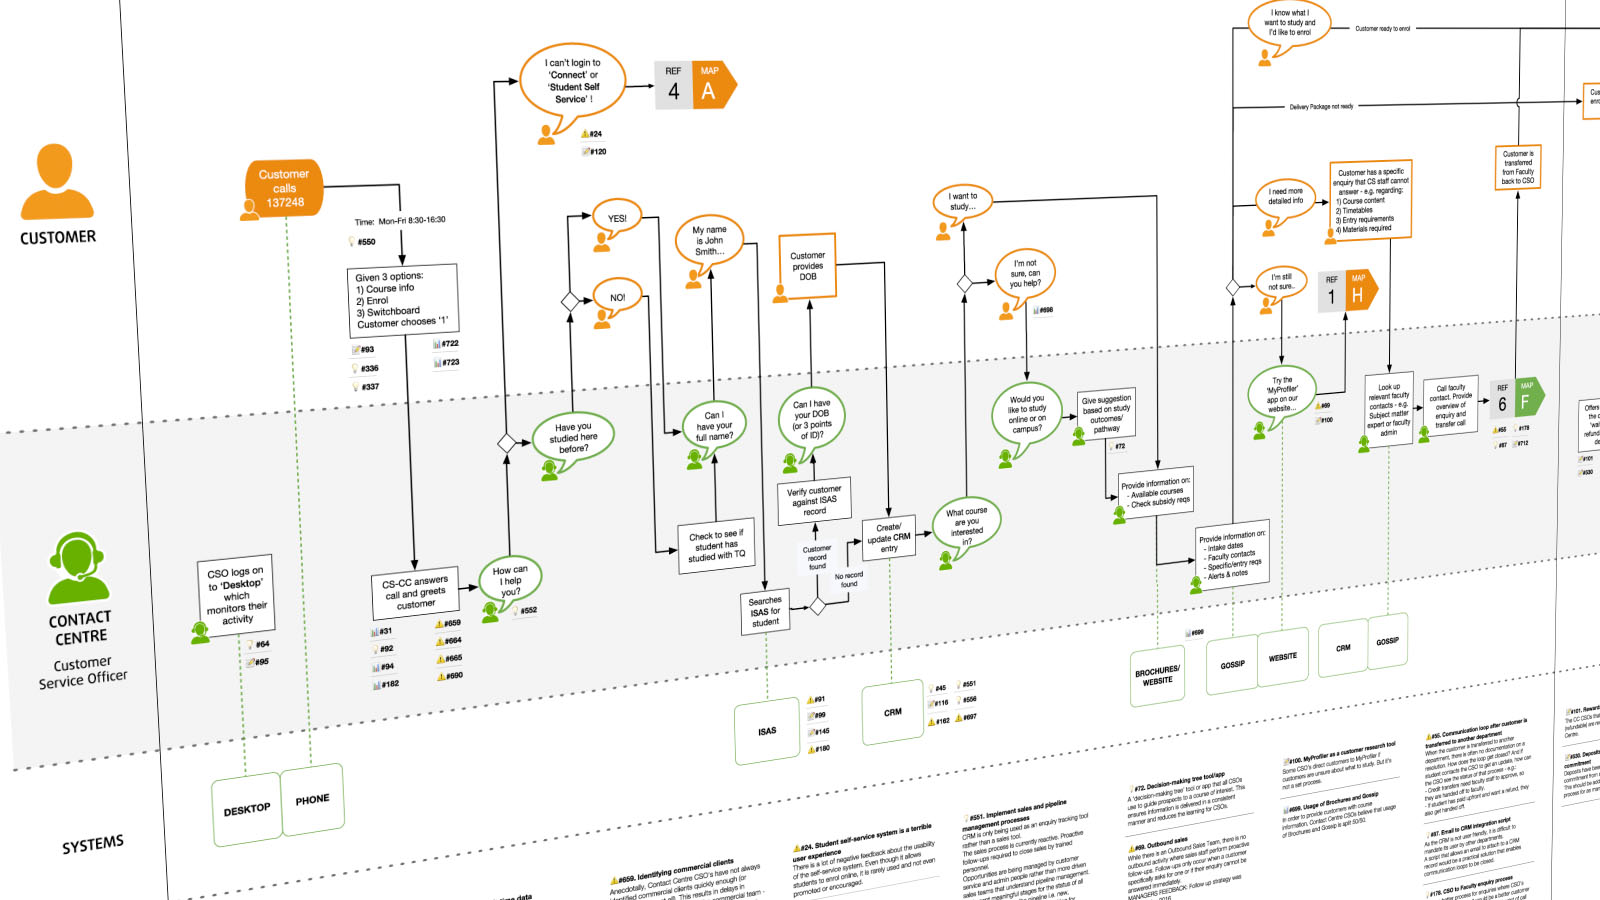
An extensive service and process mapping program was undertaken across departments including - sales, customer service, contact centre, commercial sales, student services, education planning, marketing, administration and faculties. 47 people in 35 roles were interviewed at length and on multiple occasions to assist in accurately mapping and validating the underlying processes, systems, roles and resources. Key metrics were collected to ensure a baseline was set and any improvements were measurable. All of the information collected was collated in our proprietary service design database for analysis.15 service blueprints were produced that visually mapped the pain-points and opportunities for improvement. These blueprints were accompanied with over 300 specific recommendations related to the service delivery. A further report contained insights into current challenges and provided practical and executable recommendations on how delivery could be streamlined and improved.
Incling’s proprietary service and process blueprinting highlighted and prioritised opportunities for TQB to significantly improve student and staff engagement across the organisation. During the process, many of our recommendations were implemented immediately including improvements to enrolment processes, customer service functions, sales conversion, data capture, resource allocation, marketing automation, class timetabling, and course and content delivery.
Having the processes visually mapped solves a huge problem encountered by every organisation, as processes are generally opaque and oblique and are perceived differently in the minds of different stakeholders.
The visual maps allow multiple departments such as marketing, sales and customer service to stand in a room and review and plan very effectively any strategies or chnages to the nature of the service delivery.